Analytics explained
This page explains every number and chart on the Analytics page, so you can tell which videos hold attention and which offers work.
Open Analytics
Click Analytics in the sidebar. The page opens on All videos for the last 14 days.
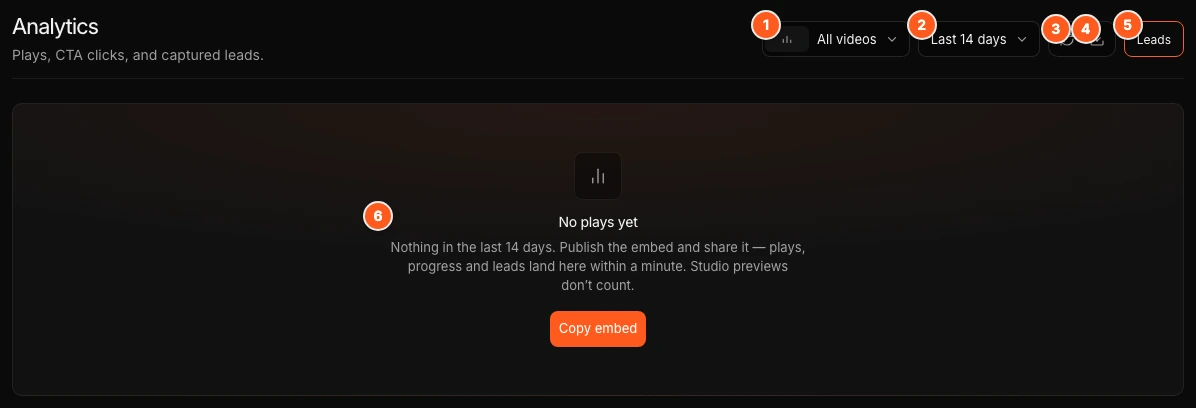
Choose videos and dates
- Video picker. Pick one video, or leave it on All videos to rank them. With one video selected, click Compare to add another. You can compare up to four videos. Each video gets its own colour.
- Date range. Choose Last 7 days, Last 14 days, Last 30 days or Last 90 days. Every number also shows the change against the previous period of the same length.
- Refresh. The report is saved when it loads. Click Refresh (the circular arrow) to include new activity. A tooltip shows when the report was last updated.
- Export report. The download icon saves the report as a CSV. See Export the report.
- Leads. Opens the list of people who submitted a form. See Leads and exports.
The metric cards
| Card | What it means |
|---|---|
| Plays | Video starts in the selected period (UTC). Each viewing session counts once per video. |
| Estimated viewers | Distinct browsers that played your videos. The same person counts again on another device, after clearing browser data, or on another video. |
| Average progress | The average furthest point reached by viewers with recorded progress, as a percentage of the video. Seeking ahead raises it. It is not time watched. |
| Leads | Accepted form submissions. The card also shows the form conversion: the share of sessions that submitted a form they were shown. |
| Purchases | Paid orders from your connected checkout. See Purchases. |
Repeated submissions count once per video version and session. Sessions recorded before form tracking started are left out of the conversion rate. The card then reads "No form exposure data yet".
Progress is not watch time
A viewer who skips to the end reaches 100% progress. Use Average video watched and Average watch time in the exported CSV for time-based numbers.
Tables and charts
- Videos by plays · top 10. Shown when no video is selected. Columns: Video, Plays, Estimated viewers, Avg progress, CTA clicks, Leads and Form conversion. Click a video to open it on its own.
- Comparison. The same columns for the two to four videos you picked. With one video selected there is no table.
- Plays · last N days. Plays over time. Switch between bar and line with the two icons. Ranges up to 30 days show one bar per day. The 90-day range shows one per week. OhPlayer remembers your choice.
- Viewing progress. The percent of viewers who reached each point of the video. Use it to find where viewers leave.
- Funnel · Play → 50% → CTA → Lead. Unique viewers at each step. The funnel is hidden when a video's numbers combine more than one version.
All versions of a video count together. When you publish an AI edit, its plays add to the same video.
Purchases
The Purchases card appears after you connect sales tracking or record a sale. It shows the number of paid orders and the revenue per currency, for example "$1,200 + €300 revenue". If some orders could not be tied to a video, it adds "N unattributed". Before any revenue arrives it reads "No revenue yet".
Test sales never count. On Lite the card shows the count and "Revenue on Pro"; click it to see the upgrade options. To set this up, see Track sales per video.
Export the report
Click Export report. The file is named ohplayer-analytics-<days>d-<date>.csv. It has one row per video and these columns:
From (UTC), To (UTC), Video ID, Video, Plays, Estimated viewers, Average progress (%), CTA clicks, Leads, Form conversion (%), Version ID, Measured sessions, Average watch time (seconds) and Average video watched (%).
What you see before there is data
| Message | What to do |
|---|---|
| No videos yet | Import a video, publish an embed, then plays and leads land here. |
| No plays yet | "Nothing in the last N days." Publish the embed and share it. Plays, progress and leads appear within a minute. |
| No plays in this period | Pick a longer date range. |
| No viewing progress yet | The curve fills in after viewers watch past the first seconds. |
| No funnel activity yet | The funnel fills in as viewers move through the video. |
Plays from the Studio preview and the private preview link do not count.
How long data is kept
OhPlayer keeps viewer analytics for 90 days. You cannot change this. Leads have their own setting. See Data, privacy and cookies.
Next steps
Was this page helpful?
Your answer stays in your browser. Nothing is sent to us or to anyone else.